
Seaborn
- Seaborn is a pthon data Visualization library based on matplotlib
- it provides a high-level interface for drawing attractive and informative statistical graphics
Importing data into Spyder
Import modules
import pandas as pd
import seaborn as sns
Importing dataframe
cars_data=pd.read_csv("Toyota.csv")Displaying dataframe
print(cars_data)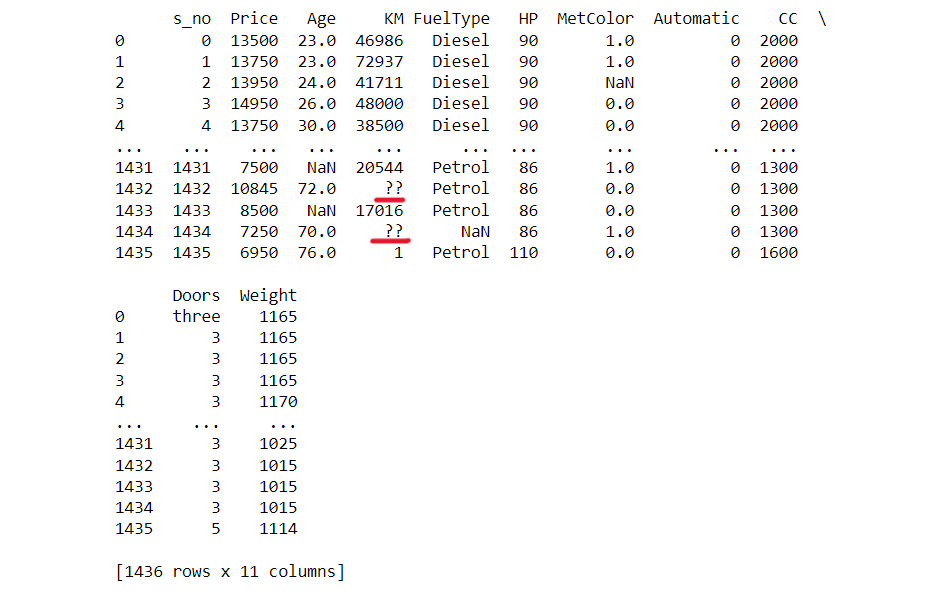
Junk values are underlined red we have to remove that
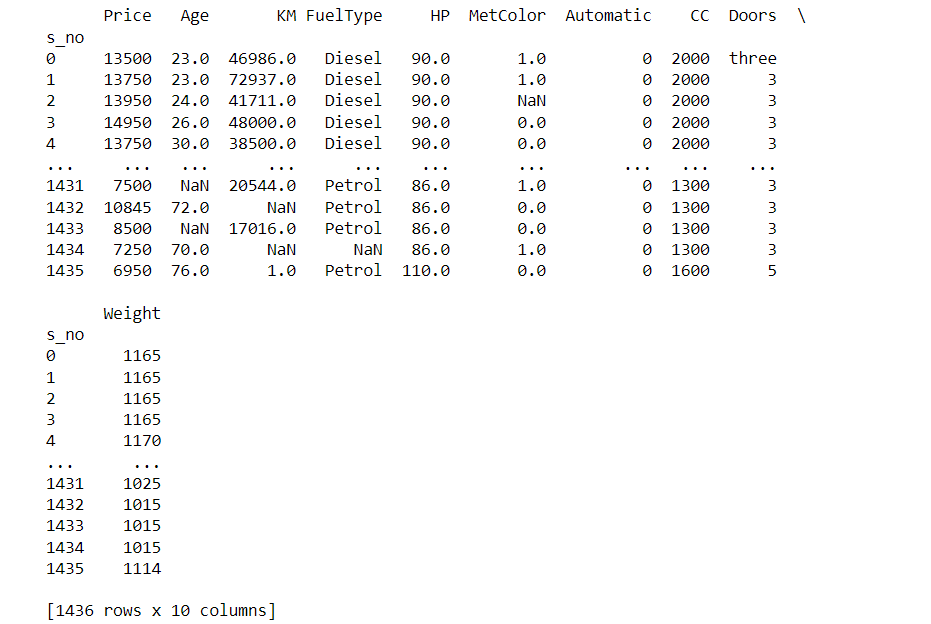
Importing dataframe by seting index and converting junk values to nan
cars_data=pd.read_csv("Toyota.csv",index_col=0,na_values=["??","????"])
print(cars_data)
after removing junk values
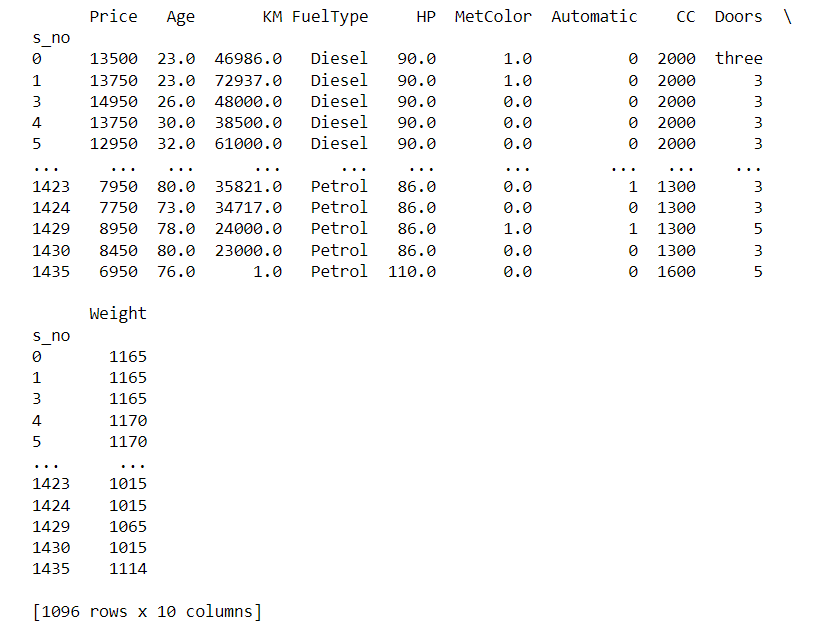
Removing nan values
cars_data.dropna(axis=0,inplace=True)
print(cars_data)
After removing nan values
Scatter plot
sns.set(style="darkgrid")
sns.regplot(x=data['Age'],y=data['Price'],fit_reg=False)
Leave a Reply